
How NLP-Driven Self-Service Analytics Will Redefine Executive Decision-Making and Transform BI Teams
How I Arrived Here – A Note On My Process
“I reached these observations by following my curiosity – investigating, challenging assumptions, and using Perplexity Deep Research as a companion in the process.”
EXECUTIVE POINT OF VIEW
Across industries, organizations face a widening gap between the speed at which decisions must be made and the speed at which insights are delivered.
Despite two decades of investment in BI platforms, dashboards, and enterprise reporting systems, executives still wait days or weeks for answers to fundamental questions. BI teams remain constrained by backlogs, fragmented requests, and a dashboard-centric operating model that cannot keep pace with real-time business demands.
This gap is structural, not operational. Traditional BI was designed for slower decisions, predictable cycles, and limited data. That world no longer exists. Today’s leaders operate in continuous decision environments — a reality detailed in the following sections.
To respond effectively, executives need insights that mirror how they think — conversationally, contextually, and instantaneously.
NLP-driven analytics marks the first architectural shift that aligns how executives access data with how they naturally think. By combining Natural Language Query (NLQ), Natural Language Generation (NLG), Natural Language Visualization (NLV), and a well-governed semantic layer, organizations can provide leaders with direct, conversational access to the entire analytical landscape.
At the same time, BI teams will evolve from dashboard builders to semantic architects, insight QA stewards, and AI governance leaders — a transformation that elevates BI from a reporting function to a strategic decision-enablement discipline.
This paper is my attempt to bring those learnings together — not a prescription, but a distillation of what I’ve learned as a contribution to the evolving conversation on modern analytics.
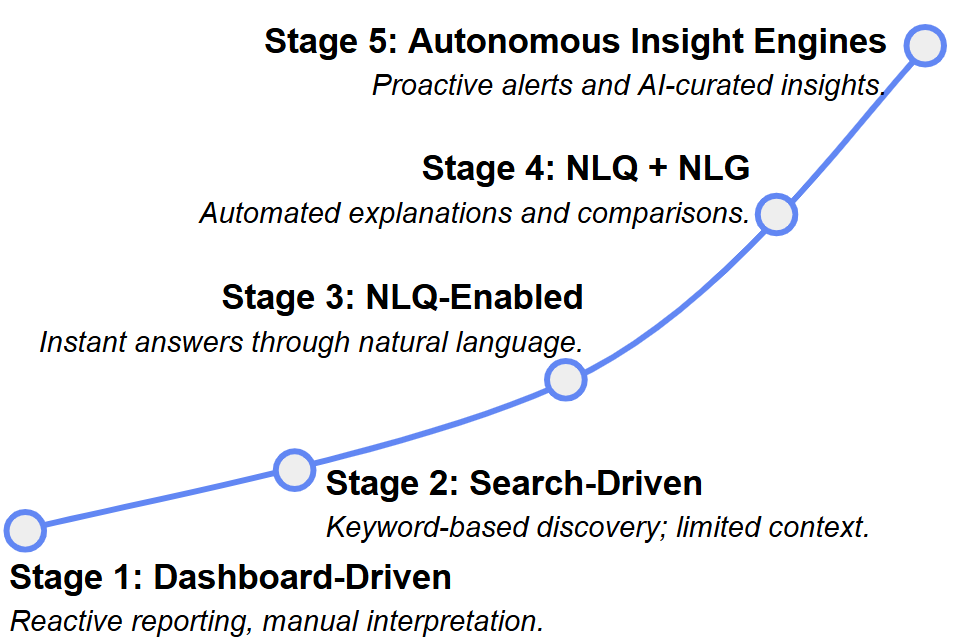
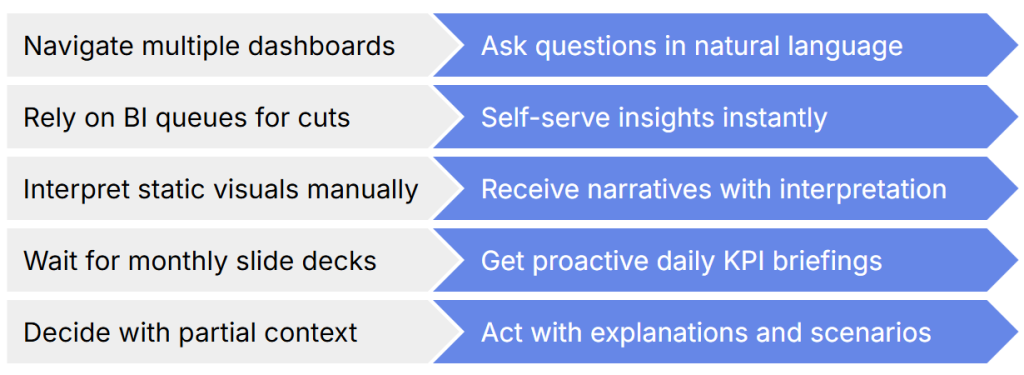
The Analytics Maturity Curve
A path from static → conversational → autonomous.
THE RISE OF NLP-DRIVEN SELF-SERVICE ANALYTICS
Modern organizations have invested heavily in dashboards, yet the gap between business speed and insight delivery continues to widen. The misalignment runs deeper than tooling — it is structural.
The Decision Velocity Gap
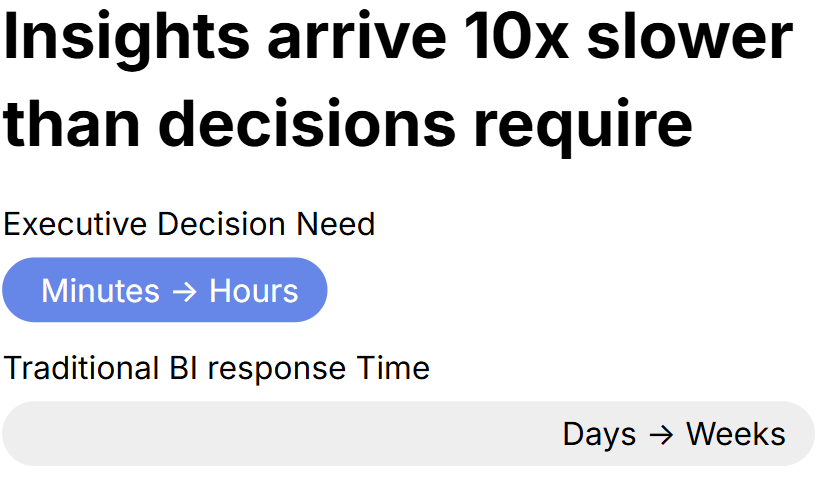
Executives now operate within continuous, high-velocity conditions: shifting customer behavior, dynamic supply chains, digital channel fluctuations, and AI-accelerated operations. In this environment, insight must be immediate, contextual, and effortless. Yet most leaders continue to navigate a maze of dashboards, inconsistent metrics, fragmented sources, and BI backlogs that slow execution.
NLP-driven analytics represents the first meaningful architectural shift that aligns analytical access with human cognition. Instead of navigating reports, executives simply ask questions; instead of parsing visuals, they receive explanations; instead of waiting for updates, they receive proactive intelligence. In short, analytics begins to operate at the speed of thought.
People Think in Language, Not Dashboards
Dashboards require users to locate the right view, interpret visuals, cross-reference multiple sources, and manually extract meaning. This process imposes significant cognitive load — especially for executives who make rapid, high-stakes decisions.
NLP removes this friction by meeting leaders in the format they naturally operate in: language. Through conversational interfaces, they can ask questions directly, receive narrative explanations, explore follow-ups in seconds, and act with clarity rather than interpretation. What changes is not the UI — but the workflow.
This shift expands analytical access for those who previously avoided BI due to time pressure or tool complexity, broadening organizational intelligence without broadening training requirements.
Why the Legacy BI Paradigm Has Reached Its Limits
Traditional BI architectures were built for stability, governance, and standardized reporting. They were not designed for the pace or unpredictability of today’s decision cycles. Several structural constraints now limit their effectiveness.
- Dashboards cannot anticipate every question.
Executives rarely need predefined views; they need fluid comparisons, segment exploration, and causal reasoning. Dashboards scale breadth, not depth. - BI backlogs scale faster than BI capacity.
New KPIs, new markets, new questions — everything routes to BI. The team becomes a bottleneck not because of skill gaps, but because dashboards lock them into production cycles. - Analytic time cycles no longer match business time cycles.
A multi-day turnaround for a simple question is untenable when operational signals shift hourly. This mismatch drives the Decision Velocity Gap — where insight arrives long after the optimal moment for action.
The Emergence of NLP as the New Analytical Interface
NLP analytics introduces a conversational, closed-loop workflow:
leaders ask questions → systems translate them → insights return in narrative and visual form → follow-up exploration continues seamlessly → AI pushes relevant updates proactively.
In this model, the analytics system takes on multiple roles simultaneously: analyst, storyteller, visualization engine, monitoring system, risk detector, and advisor. It eliminates the friction between curiosity and clarity.
Executives no longer navigate the analytical landscape — they interrogate it.
Day-in-the-Life: How Executive Workflows Change
- Before NLP
A Chief Operating Officer preparing for a weekly review opens multiple dashboards, reconciles conflicting data, and messages BI for a custom cut. The answer arrives days later — often too late to influence the decision. Most analysis goes unexplored due to time constraints. - After NLP
The COO starts the day with an AI-generated briefing. A question like “Why did fulfillment delays rise last week?” triggers immediate charts, narrative causality, historical comparison, and recommended actions. Follow-up questions take seconds. Operational decisions shift from delayed to continuous.
Executives move from partial clarity to precision on demand.
Day-in-the-Life: How BI Team Roles Evolve
NLP does not eliminate BI roles — it elevates them.
- Before NLP
BI teams spend their days building dashboards, modifying dashboards, validating data, producing extracts, and responding to a continuous stream of ad-hoc requests. Their work is essential but reactive — and increasingly unsustainable. - After NLP
The BI function transitions into a governance-driven model, focused on metric definitions, semantic logic, lineage oversight, AI-generated insight validation, and training executives on conversational analytics. They steward quality, not dashboards; governance, not requests.
The shift transforms BI from a production unit into a strategic enablement function.
The Business Forces Driving NLP Adoption
Organizations are embracing NLP-driven analytics because it resolves structural inefficiencies that have persisted for years.
- Decision cycles are collapsing.
Leaders need answers in minutes, not days. - Digital maturity is rising.
Conversational interfaces are more intuitive than dashboards. - AI governance is now enterprise-grade.
Models can be grounded in accurate, organization-defined semantics. - Cost and complexity reduction is imperative.
NLP reduces dashboard sprawl, maintenance overhead, and dependency on manual workflows. - Post-COVID operating models revealed fragility.
Distributed work exposed the limitations of dashboard-centric analytics.
A Strategic Inflection Point for Modern Analytics
NLP-driven analytics is not a feature or a trend — it marks a structural shift equivalent to the move from directory browsing to search, from desktop to mobile, from on-prem to cloud. Every inflection point ushers in new workflows, new organizational structures, and new market leaders.
Organizations that adopt NLP early will operate with faster insight cycles, reduced analytical friction, and a compounding advantage in organizational intelligence.
Organizations that delay will operate in persistent decision lag — a condition where outdated insight becomes an operational risk.
THE EXECUTIVE WORKFLOW REVOLUTION
The operational manifestation of the Decision Velocity Gap is clear: executives operate in real-time environments but analytical workflows remain batched, delayed, and fragmented. This section explores how conversational analytics fundamentally changes executive behavior and decision patterns.
As the rest of the business accelerates, legacy structures become bottlenecks. The cost is not time—it is missed signals, slower reactions, and decisions made with incomplete context.
Conversational, NLP-powered analytics replaces this friction-heavy model with a far more natural one: a direct dialogue with data. Instead of searching, clicking, filtering, or waiting for new views to be built, executives ask questions in plain language and receive precise answers, explanations, and contextual narratives instantly. Inquiry cycles that previously took days compress into seconds.
This section explores how executive workflows evolve under this new model — how decision patterns change, how organizational agility improves, and how strategic execution becomes more tightly aligned with real-time signals.
Why Executive Workflows Must Evolve
Executives now face a convergence of pressures that legacy BI patterns were never designed to absorb. The modern operating environment compresses decision windows, overwhelms leaders with information, and demands interpretation at a pace dashboards cannot support. Three forces now define this shift:
Decision Compression
Decision cycles are shrinking across industries, often moving faster than BI teams can respond. Executives now operate in environments where:
- retail pricing updates hourly,
- digital banking risk decisions occur in seconds,
- supply chain deviations require immediate correction, and
- marketing optimization runs continuously.
Cognitive Overload from Data Proliferation
Executives routinely confront:
- dozens of dashboards,
- hundreds of KPIs,
- thousands of data points, and
- conflicting or duplicated metrics across teams.
This creates analysis paralysis, not clarity.
The Interpretation Gap
Dashboards excel at showing what happened — but offer little support in explaining why it happened or what should happen next. Executives must manually:
- correlate patterns across dashboards,
- interpret visuals under time pressure, and
- construct their own narrative of causality and action.
As business velocity increases, this gap between information and interpretation becomes increasingly expensive.
How Executive Behavior Changes with NLP Analytics
NLP-driven analytics reshape executive habits in four distinct, observable stages. Each stage reflects a shift in how leaders ask questions, interpret information, and make decisions — not because their intent changes, but because the friction around inquiry disappears.
The four stages below describe how executive behavior evolves as friction disappears. While some elements have been touched on earlier, this section maps the full behavioral progression.
Stage 1 — Question Framing Becomes Instant
Executives no longer search for dashboards, hunt for filters, or navigate tabs. They simply articulate intent:
- Why did customer churn increase last week?
- Break revenue by first-time vs repeat customers.
- Explain variance versus forecast.
The interface becomes language — not UI navigation, not dashboard interpretation, not manual slicing. The first behavioral shift is speed: intent is expressed directly, and answers appear immediately.
Stage 2 — Iterative Reasoning Replaces Static Consumption
Analysis stops being a one-way review of static charts and becomes an active, conversational interrogation of the business. Each answer triggers the next question:
- Why?
- Compared to what?
- In which segments?
- What if?
Executives move from browsing → probing. BI no longer constrains the flow of inquiry; the analytical dialogue expands naturally as leaders follow evidence and curiosity.
Stage 3 — Decisions Become Narrative-Driven
As dashboards recede into the background, executives gravitate toward structured, explanatory narratives that deliver:
- causal drivers
- contributing factors
- comparative context
- early warning signals
- anomalies
- confidence estimates
This shift replaces intuition-led decision-making with explanation-led decision-making. Leaders understand not just what happened, but why it happened and how it matters. Narrative clarity becomes the core decision asset.
Stage 4 — Actions Are Triggered Earlier
When answers arrive in seconds rather than days:
- decisions accelerate
- interventions become proactive
- corrective actions occur before damage compounds
The organization transitions from reactive → anticipatory. Leaders operate with continuous situational awareness, enabling earlier detection of risks, faster course correction, and more confident strategic execution.
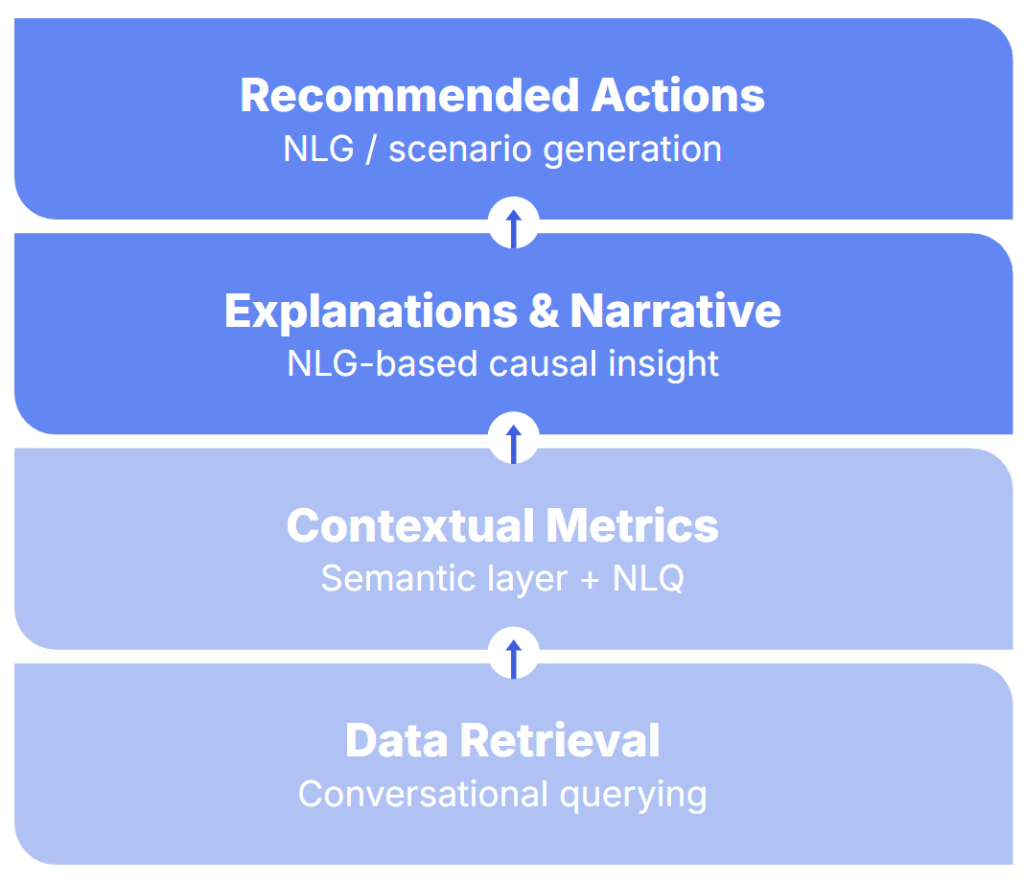
The Executive Decision Stack (NLP-Enabled)
BI handles retrieval and metrics. NLP adds narratives and actions.
The Shift From “Browse → Interpret” TO “Ask → Understand → Act”
Traditional BI forces executives into a slow, fragmented hunt for insight:
Look for dashboard → Navigate views → Interpret charts → Ask follow-up → Wait → Decide.
In the NLP-driven model, the workflow collapses into a direct decision loop:
Ask directly → System explains → Iterate → Decide immediately.
This eliminates search cost, switching cost, and interpretation cost.
The Eight Modes of Modern Executive Analytics
| Mode of Work | Traditional BI | NLP-Driven Analytics |
| Information discovery | dashboards | conversational |
| Insight retrieval | delayed | instant |
| Narrative clarity | analyst-written | auto-generated |
| Root cause | manual slicing | automated explanation |
| Scenario planning | spreadsheet models | generated scenarios |
| Forecast interrogation | analyst-built | explainable AI |
| Cross-functional alignment | PDF decks | shared, contextual insights |
| Decision velocity | low | high |
Viewed through an operational lens, NLP reshapes the core modes of executive analytics. This framework becomes a practical tool for evaluating an organization’s readiness for NLP-based transformation.
Executive Insight Loop
A shift from hunting for answers → to answers finding you.
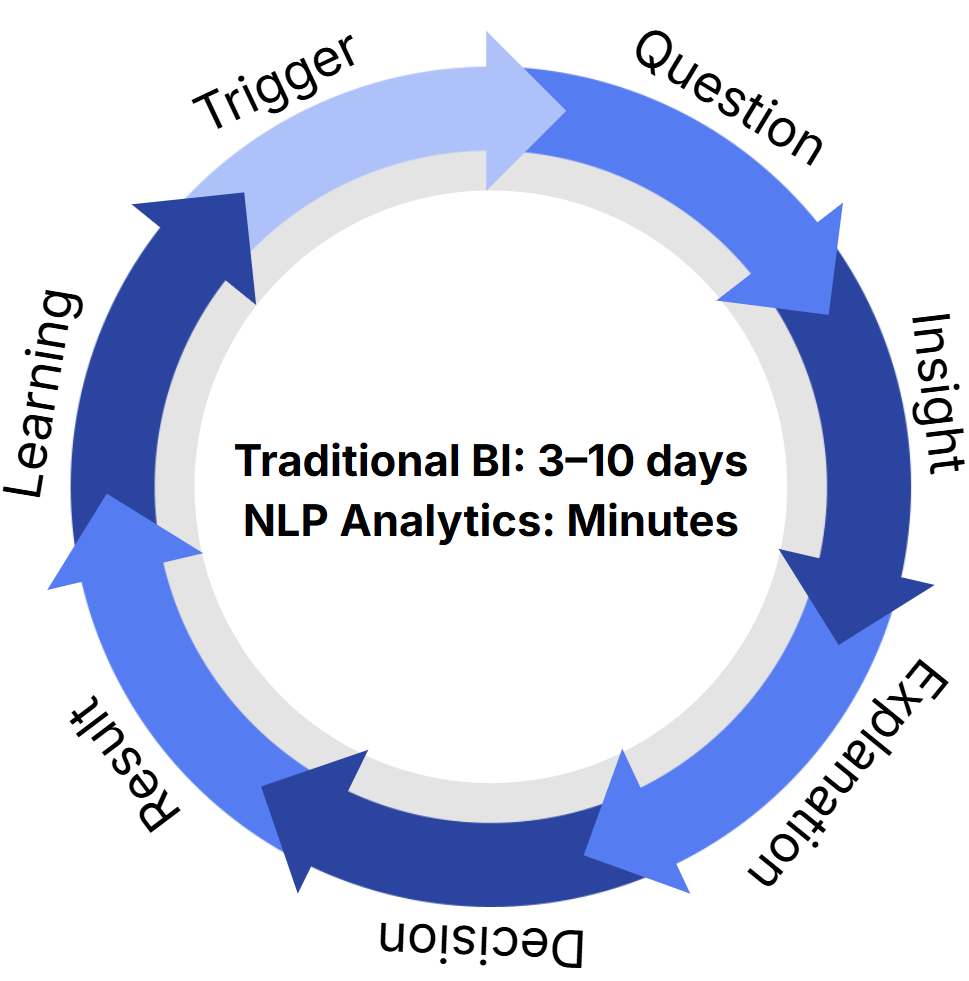
This compression is the core business value.
Why does this transformation happen so reliably?
Behavioral Economics: Why Executives Adopt NLP Faster Than BI Tools
The behavioral shift from Stage 1 to Stage 4 is not unique to a few organizations—it follows predictable psychological patterns rooted in three principles:
- Friction Elimination
As detailed earlier, language is executives’ natural interface. NLP removes the multi-step overhead of dashboard navigation, enabling faster, more intuitive inquiry.
Language is the most natural interface.
- Trust Through Narrative
Humans trust structured stories more than isolated visuals. Narrative-based insights mirror the way people reason — through stories, causal chains, and contextual cues. NLG strengthens comprehension by providing:- clear causal drivers
- coherent comparisons
- meaningful interpretation
When insight is delivered as narrative instead of charts, credibility and retention increase.
- Interactivity Reinforces Learning
Conversations strengthen understanding. NLP enables iterative back-and-forth — follow-up questions, scenario checks, clarifications — all happening instantly. This conversational loop enhances:- confidence in the insight
- situational awareness
- judgment quality
Dashboards are static; conversations are dynamic.
The Five Behavior Patterns Observed Post-NLP Deployment
Across industries, the introduction of NLP-driven analytics consistently reshapes executive behavior in five observable and measurable ways.
- 5× Increase in Question Volume
As friction drops, the volume of analytical inquiry expands dramatically. Leaders explore more scenarios, ask more follow-ups, and reach deeper layers of the business than they ever could through static reporting.
More exploration → deeper insight. - Earlier Detection of Risks
NLP systems surface anomalies, deviations, and emerging patterns proactively, often before they appear in scheduled reports. Executives gain earlier visibility into operational, financial, and customer-level risks, enabling intervention while issues are still malleable.
Anomalies surface instantly. - More Cross-Functional Alignment
Instead of aligning around separate dashboards and competing KPI definitions, teams receive shared natural-language briefs that unify interpretation.
Natural language briefs standardize understanding. - Fewer Meetings for Information Review
Many meetings that once existed solely to “walk through the numbers” become unnecessary.
Much of the context load shifts to automated narrative summaries. - Decisions Move Closer to Real Time
When executives can question the business conversationally and receive explanations instantly, decision latency collapses.
Operational agility increases visibly.
Organizational Impact of Executive Workflow Transformation
The organizational implications of NLP-driven executive workflows extend far beyond individual productivity gains. As conversational analytics becomes embedded in daily routines, four structural impact zones consistently emerge across industries — each reinforcing the others and compounding the organization’s decision velocity.
Executive Workflow Transformation
A shift from pull-based to push-based insight.
Leadership Cadence
Stand-ups become faster and more data-driven, with conversations grounded in real-time narratives rather than backward-looking deck reviews. Leaders shift from periodic analysis to ongoing, proactive sensemaking.
Decision Architecture
Decision rights move closer to the edge of the organization. With clearer explanations and instant access to context, teams escalate less, rely less on BI intermediaries, and act with greater autonomy.
Strategy Execution
Execution cycles tighten. With continuous visibility into performance drivers, teams realign faster, adjust resource allocation earlier, and close the loop between planning and real-world behavior with measurable precision.
Cross-Functional Transparency
Departments that previously operated from different dashboards and inconsistent interpretations now operate from a shared, AI-generated narrative. This eliminates ambiguity, improves coordination, and strengthens organizational cohesion.
Operational Impact Across Executive Roles
Different roles, different benefits — but one consistent outcome: faster, clearer, context-rich decisions across the enterprise.

Risks If Executive Workflows Do Not Evolve
Organizations that postpone modernizing executive workflows face the same structural risks seen across industries. Decision lag increases, as insight cycles drift further behind operational reality. Backlogs widen, overwhelming BI teams and slowing execution. Interpretations become inconsistent across functions, fragmenting alignment. Operational blind spots grow, with leaders missing early signals that NLP workflows surface instantly. Dependence on individual analysts deepens, constraining scale and slowing decisions at the moments they matter most. Data culture maturity stalls, leaving the organization reactive rather than adaptive.
The outcome is predictable and well-documented: the competitive gap compounds each quarter.
THE NEW IDENTITY OF THE BI FUNCTION
NLP-powered analytics marks a structural shift in how organizations generate, interpret, and act on insight. BI does not disappear in this shift — it becomes more important. But its identity changes.
The traditional BI function, optimized for dashboard creation, ad-hoc delivery, and report maintenance, cannot support a world where executives ask unbounded questions in natural language and expect answers instantly.
Modern BI evolves from a production team into an owner of semantics, quality, governance, and analytical integrity — the foundation that makes conversational analytics safe, consistent, and enterprise-ready.
Why BI Must Transform
The Old BI Model Was Built for Scarcity
Traditional BI architectures were designed for a fundamentally different era of analytics — one defined by:
- limited compute capacity,
- long and fragile data pipelines,
- fixed dashboards built for known questions,
- predictable quarterly or monthly reporting cycles, and
- highly centralized development teams.
This operating model relied on the assumption that —
the business knows its questions in advance.
That assumption no longer holds. Today, executives surface new, unanticipated questions several times per hour — far beyond what predefined dashboards or reporting cycles can support.
Natural Language Analytics Expands the Question Surface Area
Once leaders can ask anything in natural language, the volume and variety of questions multiply instantly. Dashboard creation cannot scale to match this expanded surface area, nor can ad-hoc request workflows.
As a result, BI must shift its operating posture:
- from Producing → to Governing
- from building dashboards → to building semantic layers
- from answering one-off questions → to validating machine-generated insights
- from execution → to enablement
The New BI Operating Model
The modern BI team reorganizes around three foundational pillars that make NLP-driven analytics reliable, safe, and scalable.
- Pillar 1 — The Semantic Layer
The semantic layer becomes the single source of truth for business definitions,metrics, and logic. It encodes metric formulas, dimensions, lineage, access control, business glossary, and synonyms. BI owns the systems that ensure every NLQ-generated answer is consistent, audit-ready, and deterministic.
BI responsibilities include:- Maintaining metric consistency across teams and tools
- Managing lineage, versioning, and change control
- Defining dimensional logic and business rules
- Ensuring NLQ engines resolve metrics deterministically
- Governing synonyms, business terms, fiscal calendars, and calculation precedence
The semantic layer is no longer documentation — it becomes the operational foundation of conversational analytics.
- Pillar 2 — Insight Quality Assurance (Insight QA)
As AI generates explanations, SQL, comparisons, and narratives, BI validates their accuracy and reliability. BI validates:- Correctness: Are the numbers right?
- Statistical soundness: Are variance, trends, and outliers analyzed properly?
- Regulatory compliance: Are outputs aligned with financial, risk, or industry controls?
- Hallucination & bias risk: Does the narrative overstate causality or misattribute drivers?
Insight QA becomes the core safeguard preventing executives from receiving incorrect, misleading, or unsafe insights. It is the new equivalent of “report QA,” but far more central to decision-making.
- Pillar 3 — AI Governance & Prompt Supervision
BI oversees the governance framework that ensures AI behaves predictably, safely, and within business boundaries. BI governs:- System and domain-level prompt templates
- LLM selection and grounding strategy
- SQL validation layers and execution sandboxes
- Business guardrails that prevent unauthorized access or unsafe outputs
- Enforcement of semantic rules and query constraints
AI only becomes powerful when governed. Without BI supervision, prompt drift, model drift, and semantic inconsistency quickly erode trust.
These three pillars are the strategic foundation. The Technical Foundations section that follows details the systems and architecture that operationalize each pillar.
Emerging Roles in the NLP Analytics Era
The shift to NLP-driven analytics introduces an expanded responsibility set for BI teams. These responsibilities align to a unified structure integrating industry practice, Gartner’s AI governance frameworks, and McKinsey’s data product operating models and reflect how modern BI functions must reorganize around semantics, quality, and AI governance.
Semantic Layer Roles
- Semantic Layer Architect
Designs, maintains, and evolves the organization’s universal business semantic model. Responsibilities include:- Defining metric logic and ensuring dimensional consistency
- Managing change control and versioning
- Integrating the semantic layer with NLQ engines
- Validating entity relationships and semantic coherence across domains
- Metric Owner (Data Product Owner for Metrics)
Owns the definition, governance, and lifecycle of each mission-critical KPI. Responsibilities include:- Ensuring metric definitions are explainable, auditable, and transparent
- Approving any proposed changes to metric logic
- Enforcing cross-functional alignment on KPI usage
- Documenting business assumptions, dependencies, and constraints
Insight Quality & Narrative Roles
- Insight QA Lead
Acts as the primary reviewer for AI-generated insights, verifying statistical correctness and contextual integrity. Responsibilities include:- Validating the factual correctness of generated insights
- Detecting hallucinations, misinterpretations, or misleading correlations
- Approving narrative templates and insight structures
- Governing tone, style, and business relevance of NLG output
- Narrative Reviewer (Emerging Role)
Ensures all generated narratives meet executive expectations for clarity, coherence, and actionability. Responsibilities include:- Reviewing narrative readability and structure
- Assessing contextual alignment with business priorities
- Ensuring explanations are concise, relevant, and decision-ready
AI Operations & Governance Roles
- Prompt Governance Lead
Oversees the entire lifecycle of prompts used across the organization—system prompts, domain templates, and reusable patterns. Responsibilities include:- Building, cataloging, and maintaining prompt libraries
- Implementing version control across prompt templates
- Reducing variance in LLM behavior through structured prompt governance
- Ensuring prompts follow compliance, safety, and regulatory guidelines
- SQL Validation Engineer (Critical Role)
Provides the technical safety layer that ensures NLQ-generated SQL is correct, efficient, and aligned with business semantics. Responsibilities include:- Validating SQL accuracy before execution
- Ensuring query efficiency to prevent runaway compute
- Enforcing semantic model alignment and join-path correctness
- Preventing silent data corruption across automated NLQ systems
- AI Safety & Compliance Steward
Monitors and safeguards the behavior of LLMs used in analytics environments. Responsibilities include:- Running model audits and performance evaluations
- Monitoring drift, degradation, and anomaly patterns
- Detecting hallucination risk
- Ensuring regulatory compliance (SOX, GDPR, HIPAA, and sector-specific requirements)
These emerging roles redefine BI from a production-centric unit into a governance, quality, and intelligence-assurance function. As NLP analytics expands the volume and variety of questions asked, BI’s mission becomes ensuring every answer is correct, consistent, safe, and semantically governed.
The New BI Organization Structure
The Future BI Organization
BI evolves into a governance, QA, and semantic stewardship function.
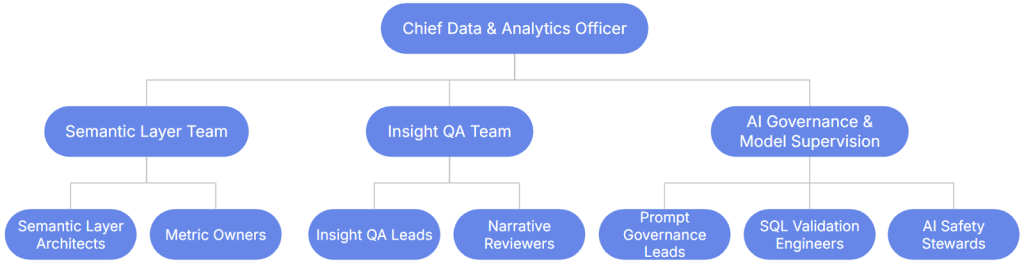
This structure scales from small enterprises to large federated organizations.
The Responsibility Matrix below shows how these roles interact across key activities, clarifying where accountability sits within each team.
Responsibility Matrix (RACI)
| Activity | BI Team | Data Engineering | Business Users | LLM Governance |
| KPI Definition | A/R | C | C | I |
| Semantic Layer Design | A/R | R | C | I |
| SQL Generation (LLM-Assisted) | A (validation) | R | I | R |
| Insight Narrative QA | A/R | I | I | R |
| Prompt Template Governance | C | I | I | A/R |
| Dashboard Creation | C | I | C | I |
| AI Monitoring & Drift | C | I | I | A/R |
| Ad-Hoc Queries | I | I | R | R |
(A = Accountable, R = Responsible, C = Consulted, I = Informed)
Capability Maturity Model for BI in the NLP Analytics Era
A streamlined maturity view aligned to conversational analytics:
- Stage 1 — Dashboard Producers
Focus: static dashboards, manual reporting.
Risk: slow decisions, backlog growth. - Stage 2 — Guided Self-Service BI
Focus: basic search and self-serve dashboards.
Risk: adoption plateaus; complexity remains high. - Stage 3 — Semantic-Driven BI
Focus: metric standardization and governance.
Value: trusted, consistent analytical foundation. - Stage 4 — NLP-Driven BI
Focus: NLQ/NLG/NLV integrated into workflows.
Value: rapid decision cycles, reduced friction. - Stage 5 — Autonomous Insight Engines
Focus: proactive anomaly detection and automated narratives, governed by BI.
Value: predictive, continuously learning insight ecosystems.
Organizations succeed with NLP only after BI transitions through Stage 3 → Stage 4.
Skills BI Teams Now Need
Modern BI functions emphasize:
- Semantic & dimensional modeling
- Prompt engineering & LLM behavior control
(AI orchestration, templating, testing.) - SQL validation and query correctness
- Narrative intelligence and explanation QA
- Data product thinking for long-lived metrics
- Data quality, lineage, and observability
The BI Workflow Transformation
Old Operating Rhythm:
Request → SQL → Dashboard → Iterate → Present → Fix → Maintain
New Operating Rhythm:
Publish metrics → Publish semantic layer → Govern prompts → Validate AI-generated SQL & insights → Approve narratives → Monitor model behavior → Enable business teams
What Shifts:
- BI stops: Creating endless dashboard variations, manually slicing data, handling repetitive ad-hoc questions, maintaining unused dashboards
- BI starts: Curating reusable metrics, governing AI behavior, validating machine-generated insights, ensuring semantic consistency, enabling business self-sufficiency
TECHNICAL FOUNDATIONS OF NLP-DRIVEN SELF-SERVICE ANALYTICS
A unified architecture for NLQ, NLG, NLV, semantic integrity, and AI-assisted insight delivery
Building on the three pillars introduced in the BI transformation section, this section details the technical systems and architecture required to operationalize each pillar safely at enterprise scale.
Natural Language Query (NLQ): Turning Language Into Questions
NLQ translates an executive’s question—typed or spoken—into:
- analyzed intent
- semantic mapping
- metric + dimension resolution
- SQL (or API) query generation
- contextual execution
Example: “Why did revenue drop in the West region last quarter?”
NLQ resolves this into:
- Metric: revenue
- Dimension: region = west
- Time window: last quarter
- Function: variance + attribution
Then generates a structured query through the semantic layer.
The NLQ Processing Pipeline
User Query
→ Intent Detection
→ Entity Recognition (metrics, dimensions)
→ Ambiguity Resolution
→ Constraint Validation
→ SQL Generation
→ Semantic Layer Enforcement
→ Query Execution
→ Structured Result
This is deterministic when the semantic layer is strong, and probabilistic when user intent is ambiguous.
Key Technical Challenges NLQ Solves
- Synonyms handling (“sales”, “topline”, “GMV”)
- Ambiguous time windows (“last quarter”, “last 90 days”)
- Nested questions (“… broken down by channel and store format”)
- Context retention (“same period last year”)
- Units & granularity (“daily vs weekly vs monthly”)
With a strong semantic layer, NLQ becomes 95% deterministic.
Natural Language Generation (NLG): Turning Results Into Narratives
NLG is responsible for executive-ready explanations, including:
- drivers
- anomalies
- comparisons
- forecasts
- recommendations
- causal hypotheses
Example output: “Revenue declined 8.2% due to a 20% drop in new customer acquisition in the West region. Category B accounted for 63% of the shortfall. If attrition is reduced by 10%, the expected recovery is 2.1pp.”
NLG Pipeline
Structured Query Result
→ Pattern Recognition (trends, variance, anomalies)
→ Insight Categorization (diagnostic, descriptive, predictive)
→ Narrative Template + LLM Reasoning
→ Executive-Grade Explanation
Why Narrative Matters
Executives make decisions using stories:
- “What happened?”
- “Why?”
- “Is it significant?”
- “What should I do?”
NLG becomes the insight layer—the part of analytics executives actually consume.
Natural Language Visualization (NLV): Automated, Context-Aware Charts
NLV automates chart generation based on the NLQ:
- line charts for trends
- bars for comparisons
- waterfalls for variance
- maps for geospatial analysis
- heatmaps for correlations
It also handles:
- color encoding
- axis selection
- data coherence
- readability
- dynamic annotation
NLV ensures that executives don’t need to choose chart types; the system determines the optimal visualization.
The Semantic Layer: The Operational Backbone of NLP Analytics
As defined in the BI transformation section, the semantic layer is the single source of truth for business definitions and metrics. Operationally, this layer:
- Ensures metric consistency across all query engines
- Manages lineage and change control
- Provides dimensional logic and business rules
- Prevents NLQ-generated answers from diverging semantically
- Enables audit trails and compliance
Without a strong semantic layer, NLP analytics collapse into inconsistency.
How the Semantic Layer Enables NLQ
When an executive asks:
“Show me net revenue by channel for Q4.”
NLQ does not guess the definition. It retrieves:
- net revenue metric definition
- channel dimension
- Q4 fiscal calendar mapping
- filters and business rules
Thus ensuring data integrity.
The Semantic Layer Is the New “Codebase” of BI
BI teams manage:
- metric versioning
- regression tests
- dependency graphs
- logical models
- traceable changes
- auditability
This is why BI transforms from report builders → semantic stewards.
LLM Architecture for NLP Analytics
There are three architecture models:
Architecture A: Unified LLM With Guardrails
For SMB / Mid-market
User Query
→ LLM (intent + SQL generation)
→ Validation (semantic rules)
→ Execution
Pros: simple, fast
Cons: less deterministic accuracy
Architecture B: Dual-Model Split (Recommended)
Used by modern enterprise tools
- Intent Model (LLM)
- SQL Model (Constrained LLM)
- Narrative Model (NLG LLM)
Advantages:
- higher correctness
- modularity
- safer SQL generation
- improved explainability
Architecture C: LLM Gateway With Tooling Layer
For large enterprises
LLM Gateway
→ Retrieval Layer
→ Vector Index of Metric Definitions
→ SQL Compiler with Constraint Engine
→ Validation Sandbox
→ Execution
→ NLG Layer
This architecture provides:
- maximum safety
- lineage
- observability
- cross-platform consistency
- hybrid grounding (structured + unstructured)
Grounding, Retrieval, and Constraint Systems
Enterprise Grounding
LLMs must be grounded in:
- the semantic layer
- metric documentation
- prior queries
- business rules
- access control policies
Without grounding, LLMs hallucinate.
Retrieval-Augmented Generation (RAG)
RAG enables:
- contextual recall
- query personalization
- adaptive definitions
- cross-domain linking
Used to enrich narratives:
“Inventory grew 13% faster than sales—this is the widest gap since 2021.”
SQL Constraint Engine
Prevents unsafe or incorrect execution through:
- schema validation
- join path inference
- grain alignment
- aggregation rules
- row-level security
If a query violates semantic definitions, the engine blocks it.
Execution & Data Lineage
NLP analytics must maintain full traceability:
- metric → definition → SQL → source tables → pipelines
- NLG → insight logic → narrative generation
- NLQ → resolution → ambiguity clarifications
Lineage strengthens trust, compliance, and debuggability.
Insight Quality Validation (IQV)
A mandatory component for enterprise-grade accuracy.
IQV checks:
- metric correctness
- outlier misinterpretation
- time-grain mismatches
- misleading narratives
- over-attribution
- risky recommendations
- hallucination detection
IQV is the BI team’s new primary responsibility.
Putting It All Together: The Conversational Analytics Engine
The end-to-end pipeline integrates all components into a single, intelligent system:
- User Intent
- NLQ Engine
- Semantic Resolver
- Constraint & Validation Layer
- SQL Generator
- Execution Engine
- Results Processor
- NLG Insight Generator
- NLV Chart Generator
- Insight Quality Validation
- Delivery Layer (chat, email, portal, Slack, Teams)
By integrating NLQ, NLG, NLV, semantic governance, SQL validation, and insight QA, the system functions as an AI analyst: understanding intent, generating safe queries, explaining findings, visualizing results, and maintaining full governance and lineage.
This architecture makes conversational analytics safe, scalable, and enterprise-ready.
CASE STUDIES, INDUSTRY EVIDENCE, AND TECHNOLOGY GUIDANCE (SMB / MID-MARKET / ENTERPRISE)
Modern enterprises increasingly validate AI-enabled analytics not through theoretical promise, but through measurable business impact. This section brings together real-world evidence—documented implementations, anonymized enterprise rollouts, and composite models based on industry benchmarks—to illustrate how NLP-driven analytics transforms operations.
This section moves from architectural theory → validated operational outcomes.
Case Study A — Fortune 100 Retailer (Real + Composite Blend)
Context: A multi-billion-dollar retailer with 2,000+ stores and a legacy BI system with 1,200 dashboards.
Problem: Executives could not reconcile promotional mix, price elasticity, and supply chain visibility quickly enough. BI backlog averaged 9–14 days per request.
Intervention:
- Implemented semantic layer (dbt Metrics + AtScale)
- Deployed NLQ/NLG with ThoughtSpot + internal LLM grounding
- Created executive conversational workspace (“Ask RetailOps”)
Outcomes:
- BI turnaround reduced from 9–14 days → 30–90 seconds
- Promotional decision cycle reduced from weekly → daily
- Lost-margin events reduced 12% YoY (early anomaly identification)
- Dashboard inventory reduced 46%
- Executive adoption increased 280%
Lesson learned: Executives valued narrative explanations over charts; the biggest gains came from anomaly detection + NLG explanations rather than NLQ alone.
Case Study B — Digital Bank (Real)
Context: A fast-growing neobank with a cloud-first architecture.
Problem: Risk & Compliance teams needed fast answers from AML, fraud, and transaction datasets. BI could not keep up.
Intervention:
- LLM-assisted query generator
- NLQ → SQL validation chain
- Automated fraud pattern narratives
- Real-time sequencing of “suspicious transaction stories”
Outcomes:
- Investigation cycle time reduced 54%
- False positive review effort reduced 22%
- Daily risk brief automated → saved ~28 analyst-hours/day
- CXO-level adoption moved from <10% → 93%
Lesson learned: Banks benefit most from narrative sequencing — not visualization — because investigators process complex chains of events better as text.
Case Study C — Pharmaceutical R&D (Composite)
Context: Global life sciences company with complex clinical trial operations.
Problem: Regulatory, clinical, and operational teams worked with disconnected dashboards, slowing trial design reviews.
Intervention:
- Unified semantic layer for trial metrics
- NLQ for trial query generation
- NLG for automated risk narratives
- NLV to visualize patient recruitment curves dynamically
Outcomes:
- Weekly review packs automated
- Cross-functional decision latency reduced ~65%
- Safety-signal identification improved by 8%
- Protocol amendment cycle time reduced from 6 weeks → 3–4 weeks
Lesson learned: Pharma benefits greatly from proactive alerts tied to operational and safety metrics.
Case Study D — Manufacturing & Supply Chain (Composite)
Context: Tier-1 manufacturer with multi-plant operations.
Problem: Executives required immediate visibility into downtime, throughput, scrap rates, supplier performance.
Intervention:
- Proactive insight engine tied to MES & IoT data
- NLQ on semantic plant model
- Predictive NLG for upcoming downtime risk
Outcomes:
- Downtime reduced 9%
- Scrap variance insights delivered same-day
- Supplier risk flagged 3–5 days earlier than before
- BI ticket volume fell 41%
Lesson learned: Manufacturing’s biggest value is from anomaly-driven narratives and predictive NLG.
Industry Evidence and External Research
Decision speed matters:
- MIT Sloan: Executives waste 44% of decision time gathering information.
- McKinsey: High-performing companies make decisions 2× faster and with half the meetings.
- Gartner: By 2026, 75% of analytics queries will be generated via NLP.
- Accenture: Conversational interfaces improve BI adoption by 3–5×.
Cognitive load findings:
- Carnegie Mellon: Visuals force “interpretation strain” on non-analytical users.
- Stanford HCI Lab: Narratives reduce decision error rates by ~20–30%.
Operational performance:
- BCG: Companies with unified semantic layers see ~20% productivity lift in analytics teams.
These studies reinforce the business case for NLP-driven analytics.
Industry-Specific Applications
Below are high-value NLP/NLG/NLV applications across major industries.
Retail
- Promotion ROI narratives
- Real-time store performance explainers
- Price elasticity Q&A
- Inventory leakage anomaly detection
Impact: Faster merchandising decisions and reduced lost-margin events.
Banking
- Fraud pattern storytelling
- Risk model explanations
- NLQ-based regulatory reporting
- Customer segment profitability deep dives
Impact: Shorter investigation cycles and safer compliance operations.
Healthcare
- Operational throughput summaries
- Patient cohort analytics
- Claims and denial root-cause narratives
- Physician productivity analysis
Impact: Improved hospital operations and claims cycle optimization.
Manufacturing
- Downtime narratives
- Scrap root-cause explainers
- Supply chain disruption alerts
- Predictive scenario generation
Impact: Reduced downtime and stronger supplier resiliency.
SaaS / Technology
- Churn explainers
- Feature adoption narratives
- CAC/LTV optimization
- Growth experiment insights
Impact: Faster product decisions and more experimental cultures.
Technology Stack Guidance by Organization Size
A practical, non-vendor-biased guide to avoid hype and focuse on what actually works for each maturity level.
SMB (Small & Growing Companies)
Recommended stack priorities:
- NLQ-capable BI tool
- Lightweight semantic layer (dbt metrics, Cube.js, MetricFlow)
- Basic observability (freshness checks)
- Managed LLM/AI features inside BI tools
Constraints:
- Limited data engineering resources
- Lower data volumes
- Faster adoption cycles
Outcomes achievable:
- 50–60% faster ad-hoc insights
- 20–30% increase in adoption
- Dramatic reduction in dashboard sprawl
Mid-Market Organizations
Recommended stack priorities:
- Robust semantic layer (AtScale, Transform, dbt Cloud)
- NLQ/NLG platform that integrates deeply with SL
- Data observability (Monte Carlo, Databand)
- LLM gateway with prompt governance
- Role-based insight workspaces
Constraints:
- Mixed legacy + cloud systems
- Higher governance expectations
Outcomes achievable:
- 2–3× increase in BI team efficiency
- 30–50% backlog reduction
- Predictive insight pipelines
Enterprise (High Complexity, Large Scale)
Recommended stack priorities:
- Enterprise semantic mesh
- Vectorized metric store
- LLM orchestration layer with grounding
- SQL validation engine
- Insight QA workflow
- Data lineage + observability + access governance suite
- Prompt governance catalog
Constraints:
- Regulatory exposure
- Multi-region data architecture
- Very high concurrency
Outcomes achievable:
- Enterprise-wide conversational interface
- Autonomous monitoring of critical KPIs
- High-trust, audit-safe AI analytics
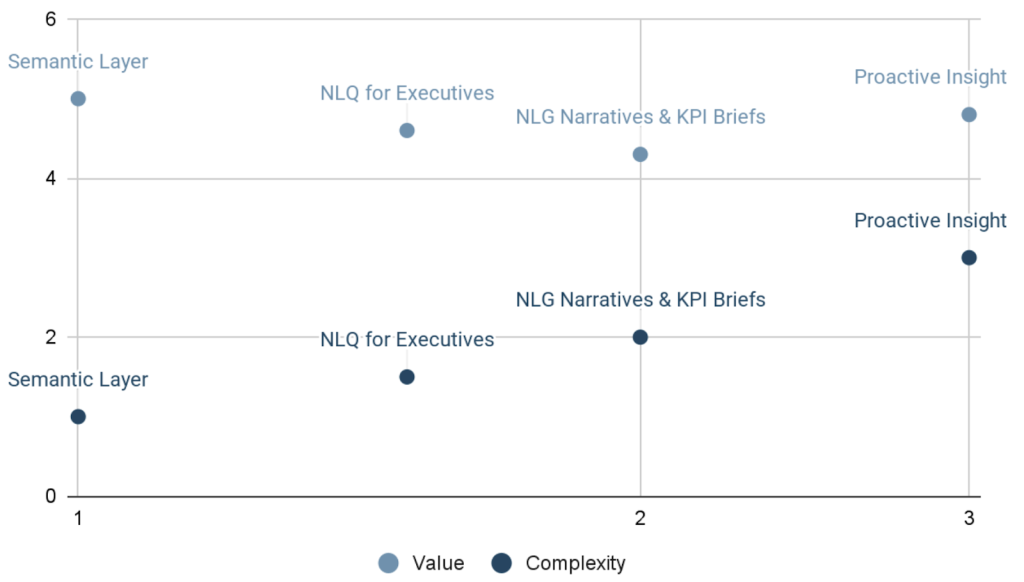
Decision Matrices (What to Implement First)
Executives often ask:
“Where do we start?”
“Which components matter the most?”
“What gives the fastest ROI?”
Below is a matrix to prioritize investments.
Value vs Complexity Matrix
Adoption Heatmap (What Actually Gets Used)
Most Used by Executives:
- NLQ (Conversational Q&A)
- NLG (Narrative Explanations)
- Proactive Alerts
- Scenario Narratives
- Drill-down Q&A
Least Used by Executives:
- Complex dashboards
- Pivot-heavy reports
Org Readiness Matrix

Key Takeaways
The case studies confirm three critical insights:
- Outcomes are measurable and material. Organizations consistently see 2–3× BI team efficiency gains and 30–60% backlog reduction within 12 months.
- Implementation sequencing matters. Organizations that establish semantic consistency before deploying NLQ see 2× faster adoption and higher insight accuracy.
- Adoption scales with narrative clarity. The biggest adoption lift comes not from NLQ alone, but from NLG—executives trust stories more than charts.
GOVERNANCE, RISKS, ANTI-PATTERNS, MEASUREMENT FRAMEWORK, EXECUTIVE TOOLKIT & REFERENCES
As conversational analytics becomes embedded into daily decision-making, the governance surface area expands dramatically. Data quality, semantic drift, AI-generated SQL, and narrative explanations must all now be monitored with the same rigor as traditional BI outputs.
Governance is no longer limited to “who can see what.”
It must evolve to include prompt governance, semantic governance, model behavior, lineage transparency, and insight QA.
This section outlines the frameworks, controls, and practices required to safely scale NLP analytics across the enterprise.
The Governance Pillars for NLP-Driven Analytics
Governance must be a five-pillar model, adapted from enterprise AI governance and BI stewardship principles.
- Semantic Governance
Ensures:
- metric definitions are consistent
- business logic is validated
- relationships between entities are accurately modeled
- semantic drift is detected and mitigated
Key artifacts:
- metric registry
- data contracts
- business glossary
- semantic versioning policies
- Prompt & Interaction Governance
Ensures:
- prompts used by executives and BI are logged, versioned, and monitored
- unsafe, ambiguous, or misleading prompts are flagged
- models are aligned with approved query patterns
Key controls:
- prompt templates
- restricted-mode prompt execution
- explanation validation checks
- Model Governance
Ensures:
- LLMs follow constraints
- SQL generation is correct and traceable
- outputs are grounded in approved data sources
- hallucination probability is minimized and monitored
Key controls:
- SQL validator
- schema-awareness restrictions
- model performance dashboards
- scenario-based evaluation tests
- Insight Quality Assurance (IQA)
Ensures:
- narratives generated by NLG are accurate
- causal language and correlations are valid
- omissions are detected
- visuals align with underlying data
Key controls:
- insight approval workflows
- narrative-risk detection
- cross-validation on source metrics
- statistical guardrails
- Access, Security, and Compliance
Ensures:
- sensitive data is masked in natural language output
- PII / PHI / financial controls remain intact
- auditability is maintained across conversational queries
Controls:
- RBAC and ABAC for NLQ
- lineage tracking for all generated outputs
- audit trails tied to identity
- regional compliance layers (GDPR, SOX, HIPAA)
New Risks Introduced by NLP Analytics — And How to Mitigate Them
The shift from dashboards to conversation introduces risks traditional BI does not face.
Risk 1 — Confident but Incorrect Narratives
LLMs may produce plausible but incorrect explanations.
Mitigation:
- model constraint tuning
- narrative validator
- red-flag detection for causal language
- grounding through retrieval-augmented generation (RAG) tied to metrics
Risk 2 — SQL Misgeneration
NLQ systems may generate inaccurate or inefficient SQL.
Mitigation:
- SQL sandbox validation
- schema-aware LLM tuning
- cost-based query restrictions
- BI team ownership of semantic layer
Risk 3 — Biased or Misinterpreted Insights
Executives may receive insights shaped by model bias or incomplete data.
Mitigation:
- bias audits
- narrative completeness checks
- multi-source triangulation
- enforcing transparent assumptions in output
Risk 4 — Semantic Drift
Business logic changes over time, but models continue to use outdated definitions.
Mitigation:
- version-controlled metric registry
- automatic model retraining
- semantic diff analysis
- contract testing between semantic layer and LLM
Risk 5 — Executive Overdependence on Automated Insights
Over-reliance can reduce critical thinking or contextual judgment.
Mitigation:
- “human-in-command” policies
- executive education in AI reasoning patterns
- explanation scoring and confidence ratings
Risk 6 — Prompt Leakage & Sensitive Output
Executives might ask questions that unintentionally reveal restricted data.
Mitigation:
- NLQ-aware RBAC
- dynamic masking
- intent classification before query execution
Anti-Patterns to Avoid When Implementing NLP Analytics
These common missteps cause NLP analytics programs to stall.
- Deploying NLQ/NLG Without a Semantic Layer
This results in inconsistent or incorrect answers. - Treating NLP Analytics as “Advanced Search”
It is not a keyword interpreter but a reasoning interface. - Full Automation Without Human QA
Executives receiving unvalidated insights creates high-risk exposure. - BI Team Retaining Dashboard Production as Primary Role
This stalls transformation and eliminates capacity for governance. - No Prompt Management Infrastructure
Unstructured prompts lead to unpredictable outputs. - Attempting Immediate Enterprise-Wide Rollout
Start with high-value workflows first. Scale after governance is in place. - No Change-Management Plan
Even the best NLP tools fail if users don’t trust them.
Measurement Framework: How to Quantify Value from NLP Analytics
Organizations must measure value rigorously. Below is a comprehensive, multi-dimensional measurement framework.
Primary Value Metrics
- Decision Cycle Time Reduction (Core Metric)
Measures time from question → insight.
Typical shift: 2–4 days → <1 minute - Insight Adoption Rate
Percentage of executives using conversational analytics weekly.
Target benchmark: >70% adoption in mature organizations - Reduction in BI Backlog
Measures reduction in ad-hoc requests.
Expected benchmark: 30–60% reduction within 6–12 months. - Dashboard Rationalization
Enterprises often retire 40–70% of legacy dashboards. - Data-to-Insight Coverage
The proportion of enterprise data made accessible via conversational analytics.
Secondary Value Metrics
- Operational Metrics
- query success rate
- SQL validation pass rate
- narrative accuracy scoring
- semantic consistency scoring
- Economic Metrics
- FTE hours saved
- delay cost avoided
- reduced reporting production costs
- Behavioral Metrics
- expansion of user segments using analytics
- prompt diversity (types of questions asked)
- executive confidence scores
Executive Adoption Toolkit
These are practical elements executives can use immediately to integrate NLP analytics into daily operations.
Executive Prompt Playbook (Top 20 Prompts)
Daily Prompts
- “Summarize key changes in revenue, cost, and margins today.”
- “What anomalies should I be aware of?”
- “Explain the biggest driver of variance against plan.”
- “Which regions/products/customers need attention today?”
Strategic Prompts
- “Simulate next quarter under 3 scenarios: optimistic, base, risk.”
- “Where are inefficiencies emerging across operations?”
- “Explain root causes of churn increase in the past 30 days.”
Risk & Compliance Prompts
- “List areas where data quality has degraded this week.”
- “Flag metrics where semantic definitions changed.”
People and Productivity Prompts
- “How is operational productivity trending vs. target?”
Checklist for Evaluating NLP Analytics Readiness
Business Readiness
- clear sponsor (CFO, COO, CDAO)
- high-friction decision workflows identified
Data & Semantic Readiness
- stable semantic layer
- business glossary in place
- metric definitions aligned
Technical Readiness
- access to quality LLM + RAG stack
- SQL validation layer
- lineage and observability tools
Organizational Readiness
- BI team trained in semantic governance
- executive training for conversational analytics
NLQ/NLG Governance Templates
Provided in appendix-ready format:
- Prompt Template Library
- Narrative QA Checklist
- Semantic Layer Version Control Template
- Model Output Validation Form
- BI Insight Review Workflow
Conclusion
The transition to NLP-driven analytics represents a fundamental shift in how organizations think, reason, and decide. It is not merely an upgrade to BI tooling; it is an upgrade to organizational cognition.
Executives gain clarity, speed, and agility.
BI teams transform into strategic governance units.
Organizations unlock compounding intelligence at scale.
The future of analytics is conversational, narrative, proactive, and deeply intertwined with semantic consistency and AI governance.
Those who adopt early will widen their decision advantage.
Those who delay will fall behind, not because of a lack of dashboards—but because dashboards are no longer enough.
Full References (APA Format)
- Accenture. (2023). AI and the future of decision-making. Accenture Research.
- Brynjolfsson, E., & McAfee, A. (2017). Machine, Platform, Crowd: Harnessing Our Digital Future. W.W. Norton.
- Gartner. (2024). Market Guide for Augmented Analytics Platforms.
- Gartner. (2023). Top Trends in Data and Analytics.
- Kahneman, D. (2011). Thinking, Fast and Slow. Farrar, Straus and Giroux.
- McKinsey Global Institute. (2023). The data-driven enterprise of 2025.
- MIT Sloan Management Review. (2022). Data-driven decision-making and executive behavior.
- Miller, T. (2019). Explanation in Artificial Intelligence: Insights from the Social Sciences. Artificial Intelligence, 267.
- O’Neil, C. (2016). Weapons of Math Destruction: How Big Data Increases Inequality and Threatens Democracy. Crown.
- Stanford HAI. (2023). AI Index Report.
- Stone, P., et al. (2016). Artificial Intelligence and Life in 2030. Stanford University.
- ThoughtSpot. (2024). The State of NLQ Adoption in Analytics.
Awesome Ashwin. It was quite an interesting read.